From soft drink factories and mineral water bottling plants to craft beer facilities, beverage filling machines have long been at the core of industrial production. But what happens when these machines change hands? The second-hand market — often discreet yet essential, holds valuable insights into the evolution of the entire industry.
An exclusive study by MachinePoint analyzes the movements, trends, and imbalances in the used filling machines market between 2018 and 2025. The report reveals a sector defined by the rise of emerging markets and the shortage of certain types of technical equipment.
Strong demand pressure in a limited-supply market
The used beverage filling machinery sector shows clear signs of recovery in 2024. Demand has increased by 32% over the past year, while supply grew by 21% compared to 2023, reaching its highest level in eight years. This rise suggests that more companies are willing to modernize their production lines and release equipment into the secondary market.
Despite this positive development, a noticeable imbalance remains, demand for used filling machines still far exceeds supply. This gap represents both a challenge and an opportunity, particularly for suppliers able to anticipate market needs.
Although data for 2025 are still partial, early indicators point to cautious optimism. If current trends persist, the market could enter a new phase of sustained expansion.
Market dominated by complete PET and carbonated lines
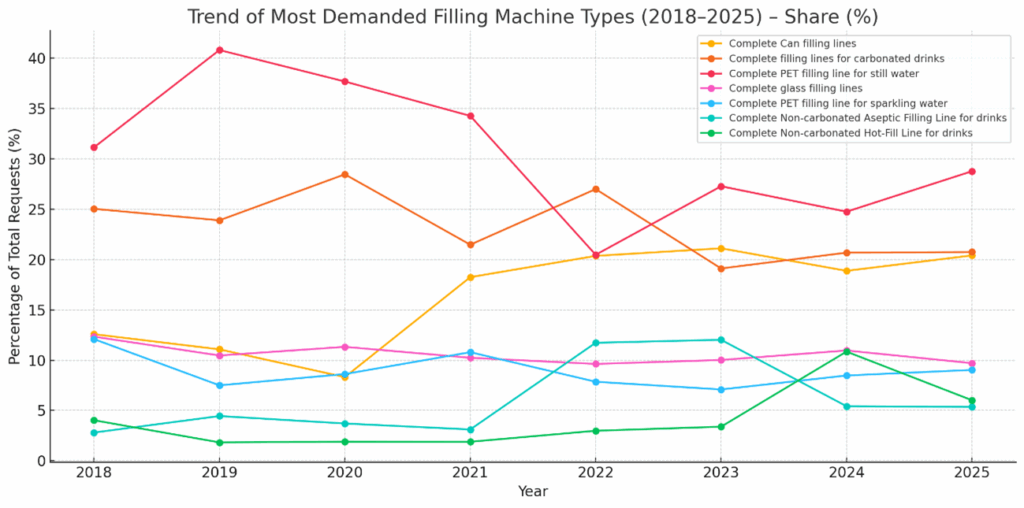
Between 2018 and 2025, global demand for used beverage filling machines has concentrated around a small group of technologies, mainly complete bottling lines for various types of beverages. The most sought-after machines have been complete PET water lines, representing 24.5% of all recorded requests.
In second place are complete lines for carbonated beverages (18.6%), followed by complete canning lines (12.1%). Since 2021, demand for canning equipment has grown significantly, driven by its strong recyclability, modern image, and popularity among categories such as craft beer, energy drinks, and flavored waters. Many producers are turning to canning lines to diversify their portfolios and respond to new consumer preferences.
Complete glass lines rank fourth with 8.3%, while PET lines for sparkling water account for 6.9%. Glass continues to be associated with premium products such as wines, spirits, and high-end mineral waters. However, due to its higher cost, fragility, and logistical constraints, many manufacturers are shifting toward more practical alternatives.
Another important trend is the rising demand for specialized technologies, such as aseptic filling lines for still beverages and hot-fill systems. These solutions, traditionally reserved for large-scale producers or niche products, are gaining traction with the growth of categories like preservative-free juices, functional beverages, infusions, and bottled teas.
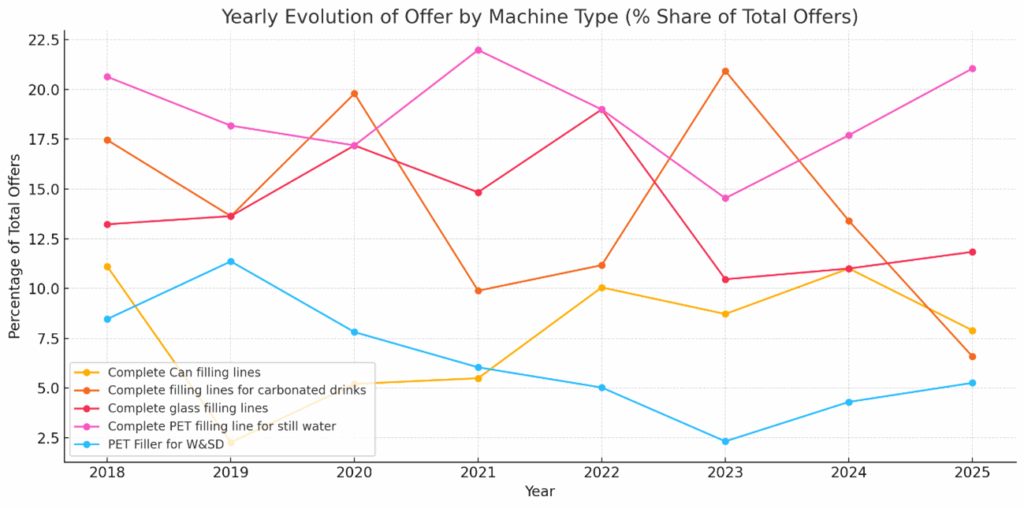
On the supply side, the pattern is largely similar, though with slight variations. Complete PET water lines also lead the market with 18.6% of the total, followed by carbonated beverage lines (14.7%) and glass lines (14.0%). Canning lines rank fourth (8.0%), while PET still-beverage fillers take fifth place (6.2%).
Overall, the market remains strongly oriented toward complete production lines rather than individual components. Although supply and demand are relatively balanced in general, certain mismatches — such as the shortage of canning lines compared to their high demand, create targeted opportunities for brokers and resellers.
The overall picture suggests that PET and carbonated beverage lines will continue to drive the used filling machines trade in the coming years.
Turkey leads global demand, while Germany and Italy dominate supply
A global analysis of the used filling machines market from 2018 to 2025 highlights Turkey as the leading source of demand, accounting for 14.2% of all recorded requests. This dominant position stems largely from strong activity in 2019 and 2021. Although demand from Turkey has declined since 2022, no other country has matched its cumulative weight.
India ranks second, with 11.7% of total requests, showing a steadier evolution and a slight rebound in 2024. It is followed by Germany (7.8%), the United States (7.4%), and Algeria (6.5%), all of which have maintained consistent demand levels over the years.
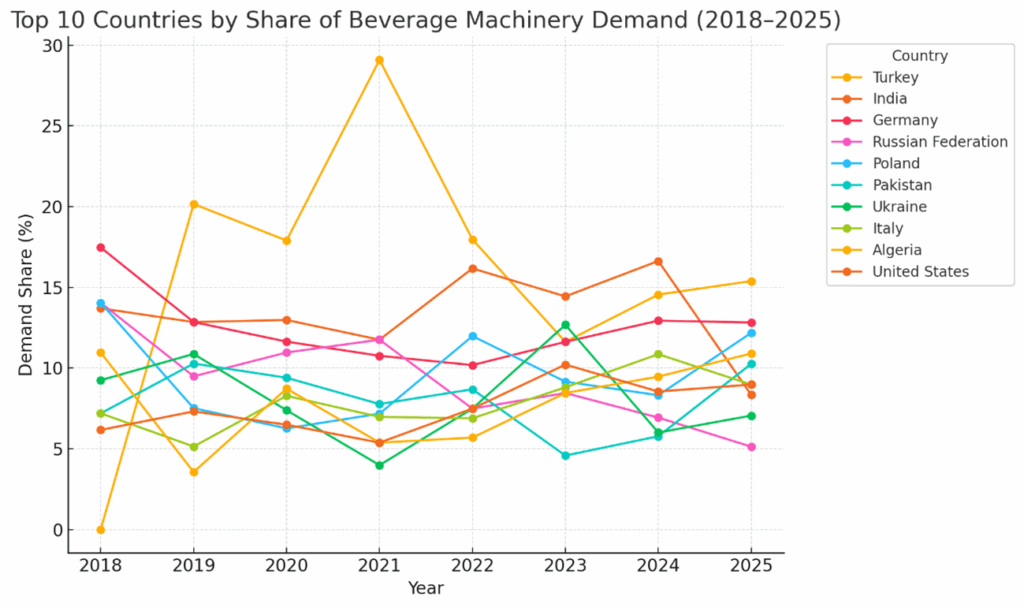
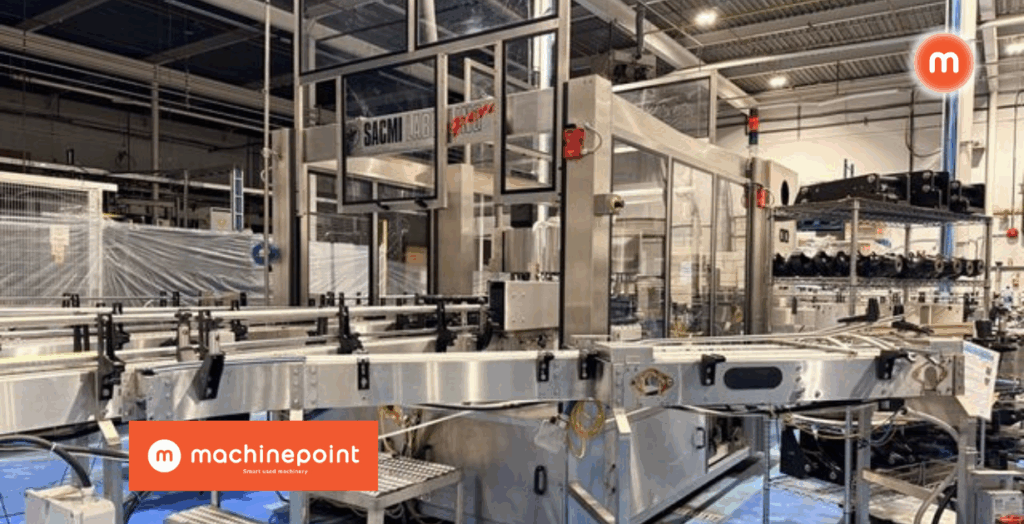
On the supply side, Europe clearly dominates. Germany accounts for 18.2% of all used beverage filling machinery available on the global market, followed by Italy (16.4%) and Poland (12.1%). The reputation for quality, reliability, and durability of equipment manufactured in these countries explains their leadership in the second-hand market.
The United States also stands out, with 8.6% of the global supply, consolidating its position as a growing exporter in recent years. France (5.2%) and Russia (4.8%) complete the top six — though Russia’s participation dropped sharply after 2022, following the outbreak of the war in Ukraine, effectively disappearing from international trade since then.